Here’s how to scan for day stocks that are making big price moves AFTER the open. Big movement during the day, not overnight gaps, is how day traders make money.
When I started day trading full-time, back in 2005, I would sometimes look at the Top % and Top $ gainers/losers list available on many financial websites. Occasionally this list would yield a couple of good day trading candidates, but quite often the move was already done. The stock had gapped up or down in the pre-market and wasn’t doing much during the day.
I developed the “during the day scan”, discussed below, to find stocks that are moving a lot after the open. To a day trader, a big gap means nothing if you can’t trade it. So my goal is to find stocks that are on the move after the open, when I can actually take advantage of those price movements.
With this method, the stocks you trade will likely change daily.
I use the TradingView Stock Screener for the job now, but I formerly used Finviz Elite. You will find tutorials on both below.
Daily scanning means more jumping around between stocks (which may require more chart windows and computer monitors). This is in comparison to another approach where we trade the same stock(s) all week based on their consistently big movement. Either approach is fine, it is just a matter of personal preference.
TradingView Screener To Find Stocks “In Play”
The following video discusses how to use TradingView to find stocks on the move in the pre-market or after the opening bell.
Pull up a chart on TradingView and click the bullseye icon in the lower right-hand corner. This will bring up the stock screener.
- At the very top of the screener, make sure you are on Stock Screener (drop down menu).
- Click the second from the top drop-down menu (says Most Capitalized by default) and select Create New Screen. Give this new Screen a name such as Day Trading Stocks.
These are the criteria I have included. You can add criteria by clicking the + icon and searching for the criteria I have used. Adjust the criteria as you see fit to suit your own trading style and preferences.
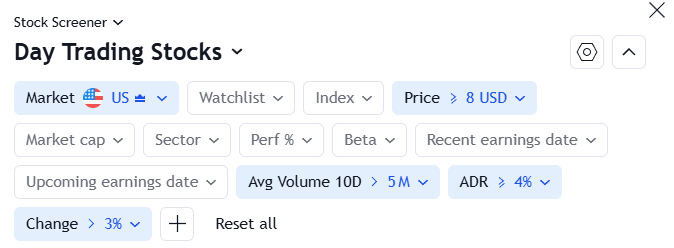
- Relative Volume at Time is another optional criterion you can add in. If this is included, this list will only show stocks with above-average volume for the last (time frame selected) compared to average volume over that same time period on prior days. Relative volume is discussed in more detail in the Finviz section below.
Click on the Extended Hours view (shown in the image below) to see which stocks are moving, and how much, in the pre-market. Only stocks that meet the above criteria will show up on the list. To see different data, click the + icon at the right side of the table and add in the criteria you want to see for each stock. Such as Chge from Open%. These generally show up in a Custom view.
Flip through various views to see different information for the stocks on the list.
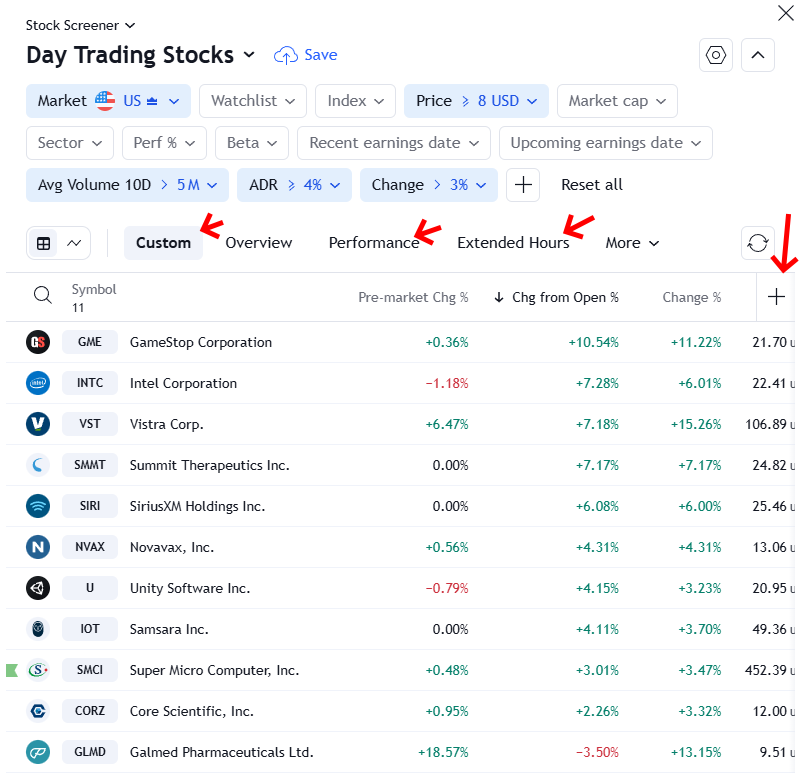
For the day above you can see that only stocks that have moved more than 3% from the prior close are included (Change %). Some didn’t move a lot in the pre-market (Pre-market Chg %), while some did, and some have had big price changes since the open (Chg from Open %).
The change from open is generally where day traders make their money. Overnight gaps don’t matter if the price doesn’t go anywhere after that. Day traders make money based on what happens after they start trading, which could be the pre-market but in most cases is after the opening bell.
- You can adjust the size of the Stock Screener window by holding your cursor over the very left edge of the screener and dragging it to the left or right to make it bigger or smaller.
- Within the screener, you can choose between seeing data or charts. Toggle between them.
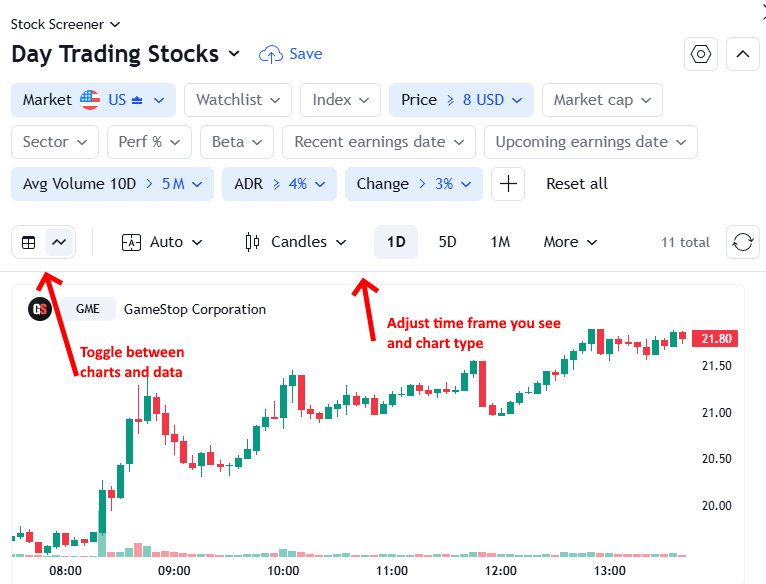
- Check the biggest upside or downside movers. These are the ones making the biggest percent moves and thus may be providing trading opportunities. You can also monitor the list for stocks moving from one side to another. For example, if you saw a stock was down 15% and then it was down 12%, then 9%, then 5% that stock is actually making a big run to the upside. It just recovered 10%! Check it out, and see if there are some tradable moves there for your strategy.
How to Find Day Stocks Moving Big AFTER the Open on Finviz
I use TradingView charts so I use that Scanner for finding day trading stocks in play, because it is free if you already have TradingView.
Using Finviz or other scanner software is also an option. You will go through a similar process to the one discussed above or below. Finviz Elite (required for real-time data) will run you about $25/month.
Here’s a brief rundown of how I scan using Finviz Elite for stocks that are making big moves during the day.
The following chart shows the criteria I use. These criteria apply to the pre-market or the first few minutes of trading. Once the market has been open for a while, keep increasing the Current Volume (starting at 100K) every half hour or so. By the end of the day, it should be Over 2 Million. This is because Current Volume is tracking the volume so far in the day, which is going to increase as the day goes on.
This keeps the very low-volume stocks off the list, and keeps the list smaller and more manageable. The other criteria are discussed below.
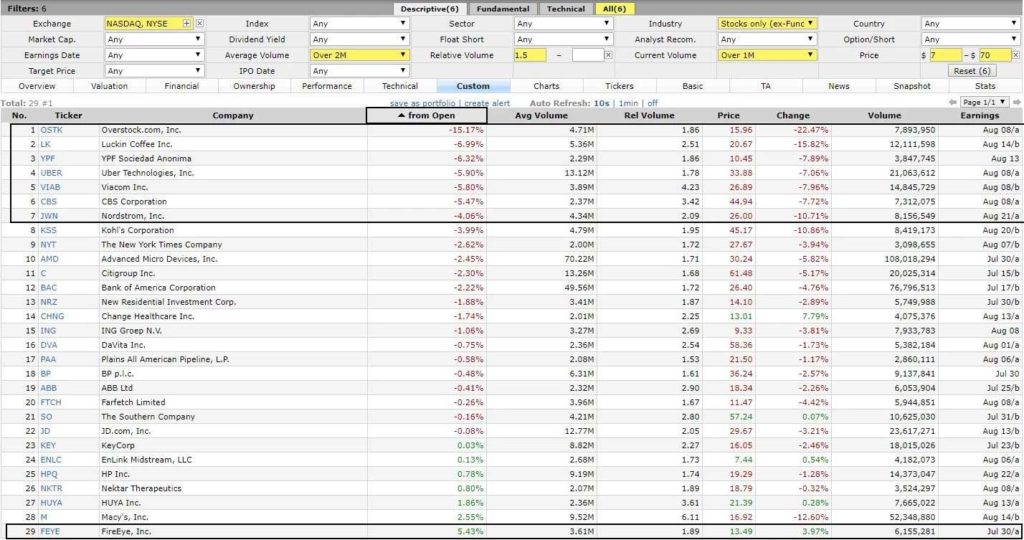
Set Auto Refresh to 10s (10 seconds), so the list updates automatically every 10 seconds with new data.
For Industry I have selected Stocks only (no ETFs). Get rid of that parameter if you want ETFs on the list as well—this will make the list quite a bit longer.
Set a Price range if you prefer stocks in a certain price area.
Set Average Volume to over 2 million (2M). Adjust based on your preferences. As indicated above, I don’t want super low-volume stocks. This criterion helps eliminate them. Ideally set this higher, like 5M+, for day trading.
If you want to limit the exchanges you trade, you can select which exchanges to include in the Exchange option. For this scan, I have included only NYSE and Nasdaq.
Relative Volume means only show stocks that have more than 1.5x usual volume up to this point in the day. We want big volume behind the big price moves. If a stock is making a big move on low (relative) volume, the movement is more likely to fizzle. But if there is a big price move and big volume, the strong movement is more likely to sustain itself.
- On Finviz, Relative volume is being calculated in real-time. For example, if average volume is 100K in the first 5 minutes of the day, and today’s volume is 150K in the first 5 minutes, Finviz will show that as 1.5 relative volume. Relative volume is updated constantly against the stock’s typical volume up to that point in the day.
You can also add another variable on the Technical tab.
Set Average True Range to Over 0.25 or Over 0.5. This means that the stock moves on average at least $0.25 or $0.5 per day. Since we want movement, this is a good way to make the list a bit smaller and more manageable. ATR is somewhat of an arbitrary measure for movement, since $0.25 of movement may be a lot in percentage terms on a low priced stock but virtually nothing in percentage terms on a high priced stock. I prefer using IntraDay Range (IR) which is a percentage calculation based on intraday movement, but Finviz doesn’t offer it. TradingView offers ADR, so it used in the TradingView scan instead f ATR.
Sort by Change from Open. You can change the columns by clicking the Settings button—near the top right of the page— and picking your own column headings.
For a day trader, Change From Open is more important than Change (which is the change from the prior closing price) because day traders don’t hold positions overnight. We only care about how much a stock is moving today; we don’t care about how far it is from yesterday’s close. The price could gap 10% between yesterday’s close and today’s open, but unless that stock is moving big after the open, there is no money to be made there. We are looking for movement NOW, not overnight.
Here’s another example, from another day, taken just before noon EST. Notice how I have increased the current volume to over 500K because it is later in the day (in this case, every stock on the list has volume over 1 million shares).
The example shows many stocks that have moved more than 5% after the open.

What to Focus on and Refinements
Focus on trading the stocks at the bottom and top of the list, when sorted by Change from Open.
These are the stocks with the biggest price moves since the open, both to the upside and downside. Go through some of the ones at the top and bottom of the list, and watch for trade setups. For ideas on how to enter and exit day trades, see How to Day Trade Stocks with a Trend Strategy.
Also, watch for stocks that are moving toward the top or bottom of the list from the middle. For example, a stock may only be up 1% on the day, but then you notice it up 2%, 3%, 4%…it goes from the middle of the list toward the top or bottom (because it is being bought or sold aggressively). Check out that stock!
You also may notice a stock at the top or bottom of the list move towards the middle. This may also be worth checking out. If a stock is up 10%, then 8%, then 6%, that stock is falling quickly. You may want to get in on that declining trend.
If the list is too long, increase the Current Volume or increase Relative Volume from 1.5 to 1.6 or 1.7.
The smaller the list, typically the easier it is to find trades. If you try to watch too much, you may end up missing the opportunities when they occur.
The Biggest Stock Movers, AFTER the Open
This is how to scan for the stocks that are making big price moves, with volume, after the open. I find this scan much better than just looking at the “biggest percentage gainers/losers” or “biggest dollar gainers/losers” lists available on many sites. As mentioned, the biggest gainer may have gapped up 20% but has done nothing since.
This list shows the stocks that are moving big right now…that are making big moves AFTER the open.
Keep an eye on the top and bottom of the list, when sorted based on Change from Open. Also, keep an eye on stocks moving toward the top/bottom of the list, or stocks starting to move away from the top/bottom of the list toward the middle. These all could signal stocks on the move right now.
By Cory Mitchell, CMT
Get step-by-step video instructions on how to day trade stocks based on patterns that occur multiple times per day.
Trade for as little as 15 minutes near the market open (trade longer to catch more trades).
Learn how in my Price Action Stock Day Trading Course.
Disclaimer: Nothing in this article is personal investment advice, or advice to buy or sell anything. Trading is risky and can result in substantial losses, even more than deposited if using leverage.




15 Comments
Leave your reply.