

Learn how Bitcoin typically moves. See how far rallies tend to run, the average size of pullbacks, and how long Bitcoin bull and bear markets last. While such tendencies may not repeat all the time, understanding Bitcoin’s average returns and declines, and its historic cycles, may help you make better trading decisions.
Here is how the article is structured:
- Total percentage gains and declines during historic Bitcoin bull and bear markets
- Statistics related to bull and bear markets (average duration, averages of all bull and bear markets)
- Breakdowns of each Bitcoin bull market, including average pullback and rally percentages
- Statistics on Bitcoin pullbacks and acceleration phase
- How Bitcoin acts when retesting all-time highs following a severe bear market
- Current Situation
- Key takeaways for trading and investing
I will continue expanding on this article, including breakdowns of each bear market and how those unfolded.
Percentage Gains and Losses in Bitcoin During Major Bull and Bear Markets
Since the late 2022 bottom, Bitcoin is up 330%. This was preceded by a 78% decline from the 2021 high of $69,000 to the 2022 low of $15,470.
70% or greater declines are noteworthy because significant rallies have followed them.
Since 2013 there have been six 70% or greater drops with at least a 70% rally following it. In most cases, the rally that followed was much bigger (101% was the smallest).
Here is how far Bitcoin rose (%) following a 70% or greater decline (before another 70% decline):
- 2,484% rally following an 83% decline in 2013.
- 101% rally following a 71% decline in 2014 (never hit the “acceleration phase” which you will learn about later).
- 12,804% rally following a 78% decline into the 2015 bottom.
- 345% rally following the 84% 2018 decline.
- 1,692% rally following a 72% decline into the 2020 bottom.
- Current situation: 347% rally (maximum so far) following the 78% decline into the 2022 bottom.

Live Bitcoin Chart on TradingView
Bitcoin Statistics for Major Bull and Bear Market Returns
The following statistics look at how far Bitcoin moves (%) during major bull and bear markets.
- Since 2013, following a 70% decline in Bitcoin’s price, the average rally is 3,485% and the median rally amount is 1,692% (before another 70% decline) from the low.
- Since 2013, following a 70% decline in Bitcoin’s price, the minimum rally (greater than 70%) is 101% and the largest rally is 12,804%.
- A 70% or greater decline has occurred in Bitcoin, on average, every 1.8 years since 2013.
- Bitcoin major bear markets tend to stabilize and turn higher following 70% to 85% declines.
- How long Bitcoin uptrends last: From a 70% or greater decline (bottom) to the top preceding another 70% decline, the average duration of a major Bitcoin bull market is 12 months with the shortest lasting only 1.8 months and the longest lasting three years.
- How long Bitcoin downtrends last: Major downtrends of 70% or more (until interrupted by at least a 70% increase in price) last on average 9 months. The shortest bear markets are 4-5 months while longer bear markets are about 12-13 months.
There must be a 70% rally following such declines to consider that decline “complete” or a major bottom.
70% is chosen because 30%, 40%, and even 50% movements higher/lower are so common that they don’t help highlight the major up and down moves in Bitcoin. Moves less than 50% are essentially small waves within these bigger price cycles.
That said, 20%, 30%, 40%, and 50% price moves are certainly important to traders and investors. And that is the purpose of this article, to highlight how Bitcoin makes its big moves and how that typically unfolds (the smaller movements during those big moves).
We’ll look at how much the price tends to pull back during uptrends in the next section.
Learn how to passively invest so you take advantage of long-term compounding. Even if you trade, consider passive investing as well.
How Much Bitcoin Tends to Pullback During Uptrends Before Continuing Higher
Looking at the really big declines and rallies, discussed above, sets a framework for the cycles of Bitcoin.
Since we can see that Bitcoin tends to have major declines of 70% or more (about every two years), and these declines are followed by generally large rallies, we can now look at the size of the pullbacks that tend to occur during those major Bitcoin rallies.
Breakdown of 2013 Bitcoin Bull Market
The 2013 Bitcoin rally was preceded by an 83% decline followed by a 2484% rally into its ultimate top (before another 70%+ decline).
Following the initial 83% decline the price didn’t just shoot up. It took 6-7 months for the price to really start moving higher. I have dubbed this the “acceleration phase.” The acceleration phase is when the price really starts running following the choppy period that tends to occur following a big decline.
The following DAILY chart shows all the 20% or greater rallies and pullbacks that occurred between the 2013 Bitcoin bottom and top.

Even after the major 2013 bottom, there were 12 pullbacks greater than 20%.
- Average pullback: 34%
- Median pullback: 28%
There were 13 rallies, followed by at least a 20% decline before the ultimate high was reached in late 2013.
- Average rally: 104%
- Median rally: 75%
Other than the initial volatility that followed the major bottom, notice how the acceleration phase is marked by much larger upward price moves, even though there are still severe declines (24% to 50%) during that acceleration phase.
Breakdown of 2014 Bitcoin Bull Market “False Start”
This is what I call the “false start”. Bitcoin dropped 71% into a 2014 potential bottom. The price then rallied, but only 101% before collapsing into another 78% decline.
Only two rallies, averaging 62%.
One pullback of 23% as the price did not recover to a new high after the next 21% decline.
Note that these rallies following the potential low (a greater than 70% decline from prior high), were similar to the choppy period following the 2013 bottom. No large(r) upside moves occurred to kick off the acceleration phase. In other words, this upward move was lacking one of the key ingredients that has occurred in all large(r) Bitcoin bull markets.

Breakdown of 2015 to 2017 Bitcoin Bull Market
The Bitcoin rally from 2015 to 2017 was immediately preceded by a 78% decline (early 2014 to early 2015). It bottomed in 2015.
Excluding the “false start” in 2014, the decline from the 2014 high to the 2015 low was 86%.

This rally lasted a long time, but also took a long time to reach the acceleration phase. There were two acceleration phases based on the upside waves increasing in size, but the first one was a bit of a dud while the second one showed price action more associated with acceleration or rapidly climbing prices.
Following the major 2015 bottom, there were 17 pullbacks greater than 20%.
- Average pullback: 31%
- Median pullback: 31%
There were 18 rallies, followed by at least a 20% decline before the ultimate 2017 high was reached.
- Average rally: 94%
- Median rally: 83%
Other than the initial volatility that followed the major bottom, notice how the acceleration is marked by much larger upward price moves, but there are still severe declines during that acceleration phase.
It took nearly 11 months to reach the first acceleration phase.
Breakdown of 2019 Bitcoin Bull Market
The 2019 Bitcoin rally ran 345% to the upside before another 73% decline ensued.
The rally was preceded by an 84% decline which bottomed in late 2018.
The 2019 high peaked below the 2017 high.
Following the 2018 bottom, there were 2 pullbacks greater than 20% prior to the 2019 top.
- Average pullback: 29%
- Median pullback: 29%
There were 3 rallies, followed by at least a 20% decline before the ultimate 2019 high was reached.
- Average rally: 105%
- Median rally: 125%

Here the Acceleration Phase kicked off during the 153% rally and was followed by another 125% rally into the top.
It took about 5.5 months to reach the acceleration phase.
Breakdown of 2020 to 2021 Bitcoin Bull Market
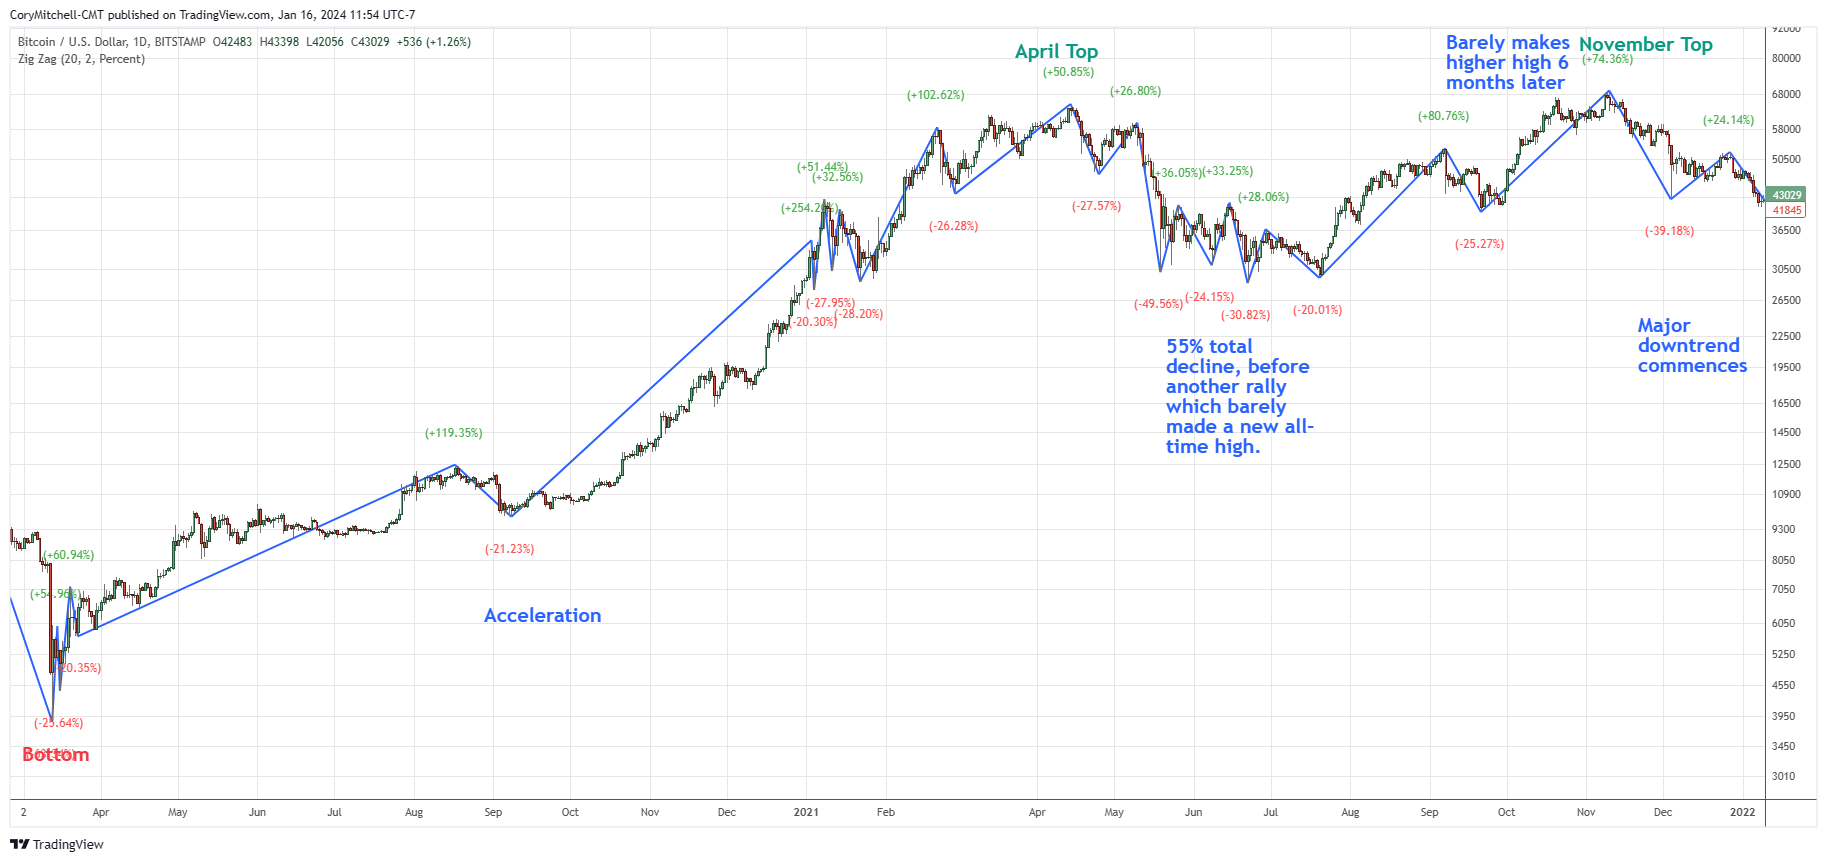
Following the 2019 high, the price fell 73% to the 2020 low. This was followed by a 1,692% rally into the November 2021 high.
It was a 1,570% rally into the first 2021 high (April). This first high was followed by a 55% decline before the price rallied back to make a slightly higher high (6 months later) in November. The November 2021 high was followed by a 78% decline.
To keep the chart less cluttered I have calculated the declines and rallies between the 2021 and the first 2021 top (April).

Following the 2020 bottom, there were 7 pullbacks greater than 20% before the 2021 April top.
- Average pullback: 24%
- Median pullback: 26%
There were 8 rallies, followed by at least a 20% decline, prior to the April 2021 high.
- Average rally: 91%
- Median rally: 58%
Here is how the whole rally unfolded including the extended drop in 2021 which was followed by a slightly higher high in November 2021.
Breakdown of 2023 to 2024 Bitcoin Bull Market – Ongoing
From the 2022 bottom to the highest price reached in 2024 (as of writing) the maximum gain is 217%. This rally was preceded by a 78% decline.
Following the 2022 bottom, there have been 3 pullbacks greater than 20% so far.
- Average pullback: 22%
- Median pullback: 22%
There have been 4 rallies, followed by at least a 20% decline, so far in the 2023/2024 Bitcoin bull market.
- Average rally: 62%
- Median rally: 61%

Interested in day trading? Check out my Price Action Stock Day Trading Course.
Statistics on Bitcoin Pullbacks and Acceleration Phase
- Average percentage gains of a major bull market in Bitcoin after a 70% or greater decline (before another 70% pullback) is 3,485% (rally percentage from the low point). The median is 1,692%. The smallest rally is 101% the largest is 12,804% since 2013.
- Average Bitcoin pullback during a bull market: 27% (median 27%). Only declines of 20% or more are included.
- Average Bitcoin rally during a bull market: 91% (median 75%). Following a 20% or greater decline and before another occurs.
- The average time it takes for Bitcoin to reach the acceleration phase of a bull market following a major bottom: 7.8 months, but the 5-6 month time frame is most common.
- Average gain (following a 20% pullback) it takes to enter the Bitcoin acceleration phase: You’ll want to see at least an 80% rally (with no 20% or greater pullbacks) to potentially be in an acceleration phase. Rallies of 100% are better. Also note the time frame of the acceleration phase. They don’t start till at least 5 months after a major bottom. Note the 70% decline and the ensuing price action. It will often be choppy. The start of the acceleration is often the upside wave that is much bigger than the chop that preceded it.
Check out Best Bitcoin ETFs in Canada (Ranked) if looking for an ETF alternative to investing/trading directly in Bitcoin.
How Bitcoin Acts When Regaining All-Time Highs After a Severe Bear Market (70%+ Decline)
After a severe bear market (70% decline or more from prior all-time high), when the price gets back near that level there is often volatility. The price will fluctuate from 15% to 34%, often for a month or more, whipping around before ultimately continuing higher.
In early 2017 When the price neared the 2013 high, the price got within a few percent and then dropped 34% before quickly rallying back. The price made a slightly higher high and then dropped 33% before staging a major rally into late-2017 high. The price chopped around for four months before ultimately continuing the uptrend. After actually reaching the high, the quick pullback and rally took two months.
The 2017 high wasn’t revised until late 2020. The price pulled back 16% after reaching the high and then whipped around for a few weeks before ultimately continuing higher into the April 2021 high.
There was a non-severe bear market that followed, declining 55%. Bitcoin reclaimed the prior high, setting a lightly higher all-time in late 2021. This too saw lots of whipsaws but isn’t included in our analysis because the test of the all-time high wasn’t preceded by a deep and drawn out and severe bear market (like the rally in 2023/2024).
The all-time high in late 2010 at $69,000 stood until 2024. The level was breached on March 5, 2024 just marginally, and the quickly fell as much as 15% before recovering. This one again shows that whipsaws and volatility tend to occur near all-time highs following a severe bear market.

In 2013, Bitcoin made an all-time, dropped more than 70% and then retested the all-time high later that year. It blew through the all-time high with little whipsawing. That is not the scenario we are in 2024 because we have already witnessed some whipsawing near the high.
Prices have ultimately continued higher after the volatility. 2017 was a notable exception, but it was also not preceded by a major bear market. Revcovies following severe bear markets tend to be very strong, pushing the price well above prior all-time highs as the uptrend unfolds.
Whether that will happen this time is unknown, but it is what has happened in the past.
Bitcoin’s Current Situation
Bitcoin had a 78% decline between late 2021 and late 2022. Such declines have generally led to large bull markets. The exception is 2014 when the price only rallied 101% off the low. As you now know, that rally never had an “acceleration phase”. The 2023/2024 rally does, so a bigger rally is more likely (and is unfolding). The next Bitcoin halving date is also near, which can also be taken into consideration, as it may impact the current price rally.
Having already exceeded the 101% “false start” rally of 2014 (which didn’t have mean acceleration phase), the next smallest historical rally following a 70% or greater decline is 345% (other rallies were much bigger, as highlighted above).
From the 2022 low of $15,470, a 345% rally puts a target near $69,000, which is the 2021 high.
Other historic rallies off lows have been much bigger, so targets could be placed well above that and still be within historical norms. For example, a 500% rally, which is smaller than many historic rallies, puts Bitcoin near $93,000.
This rally is already 15 months old. Average bull markets last about that long (but have been longer and shorter in the past).
The acceleration phase has started, based on the strong wave higher in late 2023 and another one in early 2024. In all prior cases, at least one large up wave (50% or more) has occurred following the pullback after the first acceleration wave. In most cases, this was followed by more large upwaves, except for 2019 (only one more).
The acceleration phase has experienced one pullback of 20% or greater (21.93%)
These are statistics. They can’t trade for us. Our job is to manage what comes at us. Hopefully, now you have a bit more of an idea of how much Bitcoin typically pulls back and trends.
There are lots of ways to trade and invest. Use the data how you like.
Key Takeaways for Trading or Investing in Bitcoin
- It is volatile. On average, Bitcoin has a 20% or greater drop every couple of months, even during bull markets.
- Tend to only see 50% or greater declines during bear markets, not bull markets. There is the occasional exception where the price dropped 49% and then continued the uptrend, but usually 50% declines are a major indication of issues with an uptrend.
- To buy and hold during a major bull market will require holding through multiple 20-40% declines.
- Buy and hold is not the only option. Understanding the dynamics of how the price typically moves gives a fuzzy road map of how far the price tends to move before pulling back.
- Any price moves under 20% have been completely ignored in this article because there are too many of them. That said, such moves could certainly matter to you. Investigate and study charts if you need more information on how you want to trade/invest.
- Waiting for the acceleration phase to get involved is an option. While it means giving up some potential profit early in the trend, it also means avoiding the choppy trading that often ensues for months after a major bottom. Also, it is hard to determine if a bottom has actually occurred until you start getting those big upside moves to signal a new uptrend.
That said, after a 70% decline, I am watching the charts closing and looking for low-risk opportunities to enter as a large up-move often unfolds over the next year or two. - These are just statistics in this article, not a strategy. The statistics can be used to enhance strategies, but they are not meant to predict what will happen in the future. To trade or invest in Bitcoin you still must come up with a strategy that includes when and why you will enter and when and why you will exit. Even if holding for the long-term, consider these things.
To learn about swing trading forex, trading on your schedule, and how to improve your trading, check out my Forex Swing Trading Course.
Cory Mitchell, CMT
Disclaimer: I own Bitcoin. Nothing in this article is personal investment advice, or advice to buy or sell anything. Trading is risky and can result in substantial losses, even more than deposited if using leverage. Affiliate links are used on the site.


Leave a Reply
Leave a well-reasoned comment or question.