

The stock market has certain intraday patterns that commonly occur. If you watch an intraday chart of the SPDR S&P 500 ETF (SPY), for example, you’ll see that it tends to trend and reverse at similar times each day. It also has periods that tend to have high volume and movement, and low volume and movement.
These are called “time-of-day stock market patterns.”
Such tendencies can be used to enhance trading performance.
There are some common, reliable, and repeating patterns, and other intraday patterns that are more obscure, such as what time of day price reversals are likely to occur.
We’ll briefly look at Common Patterns and then look at the lesser-known Time of Day stock patterns.
The patterns discussed below occur in stock indices, but may also occur within individual stocks.
Common Stock Market Intraday Patterns
The stock market opens in the US at 9:30 am and closes at 4 pm, Eastern Time. Because of the opening and closing schedule, a number of common patterns occur.
Volume and volatility are highest at the market open.
- Volume is high when the stock market opens at 9:30 am. It remains high for the first several minutes and then generally drops off over the next couple of hours. People are rushing in to buy/sell based on news or events that happened overnight or the prior day, and all the orders placed overnight are being filled.
- Volume is also high at the 4 pm close and a few minutes prior. People are closing positions, or entering positions for the next day, at this time.
- The largest price moves in the shortest amount of time tend to occur just after 930 am, and up to 45 minutes after. After 10:15 EST, the price generally calms down (relative to the opening flurry).
This is useful because it highlights where the action is. Experienced day traders know this, often opting to only trade the first hour, maybe two, of the trading day because volume and price movements tend to be highest. After that, price movement and volume may drop off. After NY lunch hour the movement tends to pick up again.
We’ll discuss this in the Time-of-Day patterns below.
The Price Action Stock Trading Course shows you how to capitalize on multiple opportunities within the first 30 minutes of the trading day. Trade longer if you wish, but 30 mins a day is all you need.
Stock Market Time of Day Patterns
There are certain times of day that tend to produce certain intraday patterns in stocks.
Below, I break down the trading day into time zones, and then explain what tends to happen in each of those zones. I find the early morning patterns the most reliable.
The zones are not exact. For example, reversals may occur around 10 am EST, but not exactly at 10. It could occur at 9:50 or 10:06…or not at all. These are tendencies, not exact figures. Trading isn’t that easy.
What the Stock Market Tends to Do at Different Times of the Day
Time-based patterns are based on the time of day, not price direction. A reversal could be a reversal of whatever trend direction was occurring up to that point, if there was a trend.
9:30 am:
Traders come rushing in and the price often sees a quick push either higher or lower. The price may bounce around for several minutes before picking a direction.
Lots of movement in the first few minutes means it’s likely to be an active day, or at least start out that way.
If there isn’t a lot of movement in the first 15 minutes of the day, then it will probably be pretty quiet. Action could come in later, but until it does, it will be quiet (that may sound obvious, but it means don’t trade expecting action until there is action).
9:45 am:
There is often a big pullback or reversal around this time.
If the price had moved strongly after the open, now is the time to be careful. It could be a brief pullback, providing an entry into the existing trend, or it could be much more severe.
10 am to 10:30:
Around 10 am there’s often a major reversal in price. It could be temporary, or it could be significant. The high or low that occurs around this time will often last an hour or more, especially in individual stocks.
11:15 to 11:30 am
The London Stock Exchange closes at 11:30, which means a large group of European traders are finishing up for the day and won’t be trading the rest of the US session.
These traders may need to buy/sell positions for their next day or close out positions. This 15-minute time window often sees the price head back toward a high or low, possibly re-testing it.
Heading into 11:30 is usually the last big(ger) price move of the morning. Since a (European) group of traders is about to leave, and the New York lunch hour follows, these moves often fizzle out and turn into sideways chop.
11:30 am to 1:15 pm
12 to 1 pm is the New York lunch hour, and it is generally marked with lower volume and lower overall movement.
When I day traded for a prop firm, we had a guideline that no one on the floor traded during the NY lunch hour. It was notorious for chipping away at the gains made in the morning. Generally, it is best to avoid this time entirely as a day trader, unless you develop a strategy specifically for it.
1:15 to 2 pm
Action starts to pick up after the mid-day lull. A tight range during lunch will see the price breakout. Basically, we go from a contraction in movement to an expansion in movement.
Lunch isn’t always quiet. Some days there are big movements during lunch. If there were big moves, they will probably continue.
2:15 to 2:45 pm
Possibly lunch saw a trend develop, or a trend developed after lunch. Sometimes as early as 2, but often between 215 and 245, there is a significant trend reversal. There may be several major swings during this time as the action picks up heading into the close.
3 to 3:45
Lots of shakeouts occur in this period as well. There is often a major direction change in this time span as the price heads toward the close. This is the last chance to catch the remaining price moves of the day.
3:58 to 4 pm
As a day trader, unless the price is moving in your direction, consider closing out the position prior to this period. The last couple of minutes of the day can see extreme price movement, erasing (or adding to) existing gains or losses. Holding position into these final two minutes is a gamble on which way it will go.
At 4 pm, liquidity in many stocks disappears, which means you could be holding it till the next day if you don’t get out in time. Very high-volume stocks will often continue to trade after the market officially closes, but once again, it’s a gamble on whether there’s any benefit to holding until the close.
A Note for All Times of Day
If these tendencies develop on a particular day, and we are watching for them, great. We can trade them. But don’t assume they will happen and make trades based on the assumption. If waiting for a reversal, wait till it actually starts and aligns with a strategy. Time of day patterns are not a strategy in and of themselves. A complete strategy requires entry, exit, position sizing, and other rules covered in the Trading Plan.
The Passive Stock Investing Using ETFs eBook is now available! Follow the guide to compound money in the background—in good conditions and bad—with little effort, even while swing trading and day trading.
Chart Examples of Time of Day Stock Patterns
I have written a number of articles on this topic over the years, as I have been tracking it since 2006. The charts below show the same general intraday stock patterns repeating over the last decade.
July 28, 2022 Time of Day Stock Market Patterns
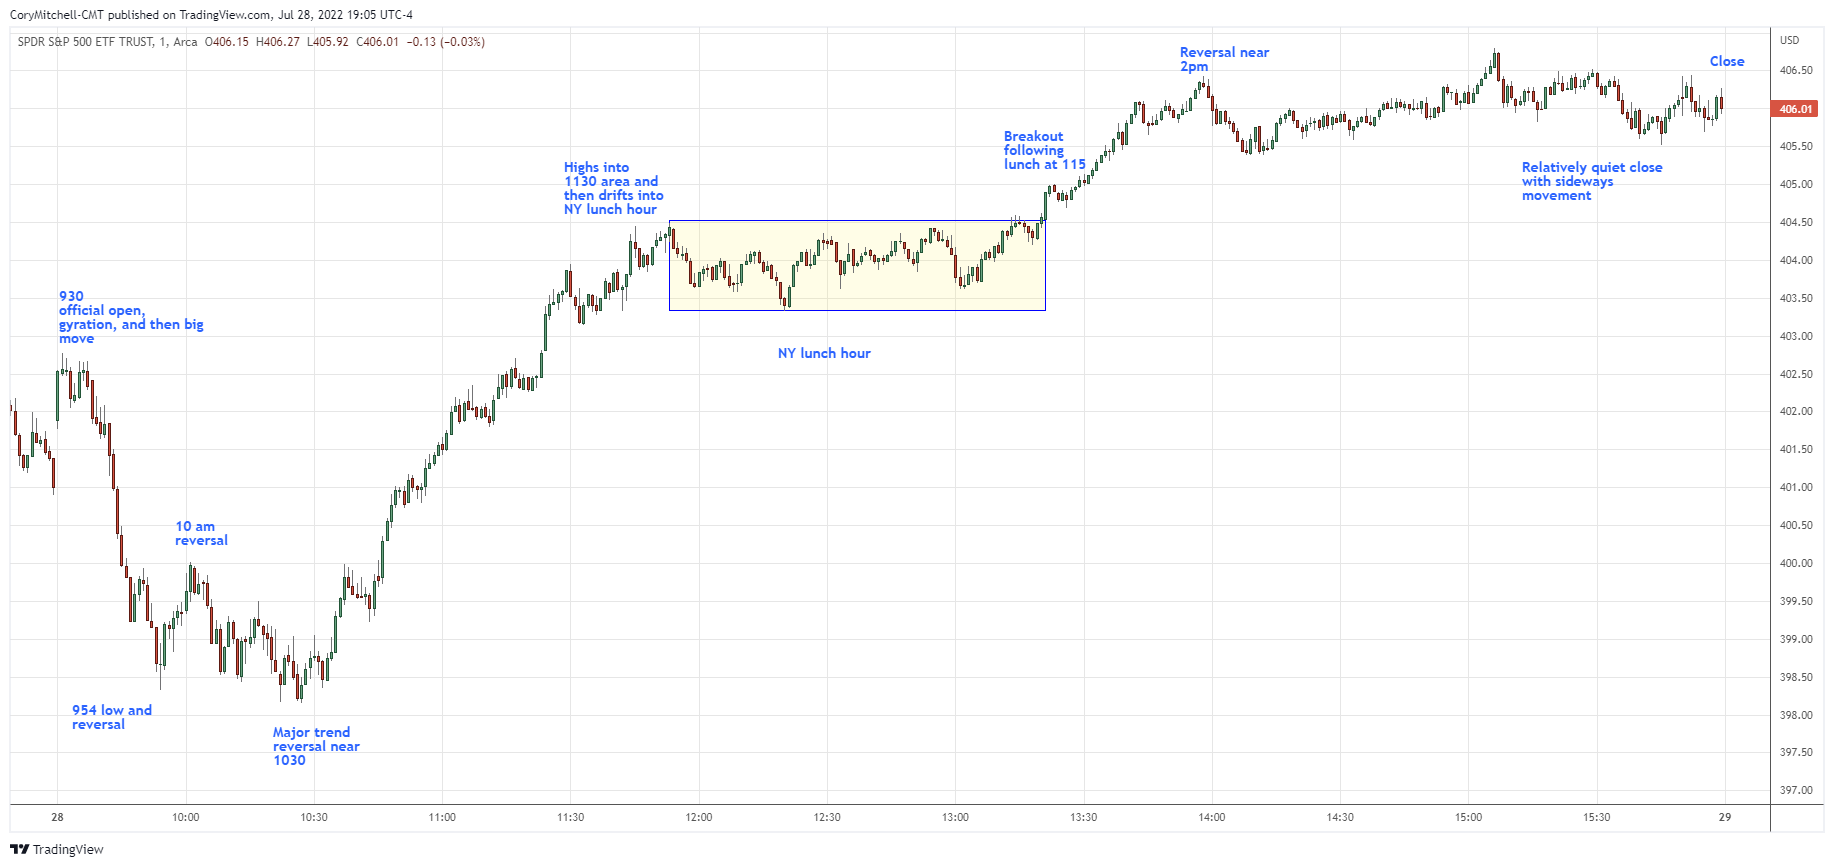
Chart example of time-of-day patterns from 2019

Chart example stock market intraday patterns from 2019

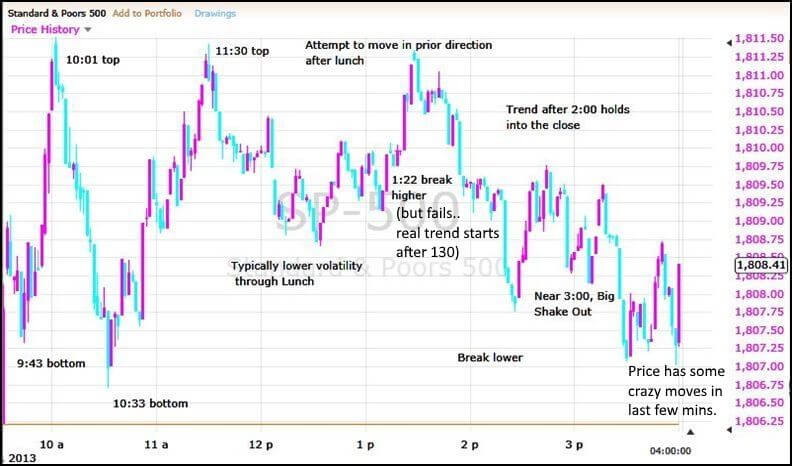
Chart example of time-of-day patterns from 2013
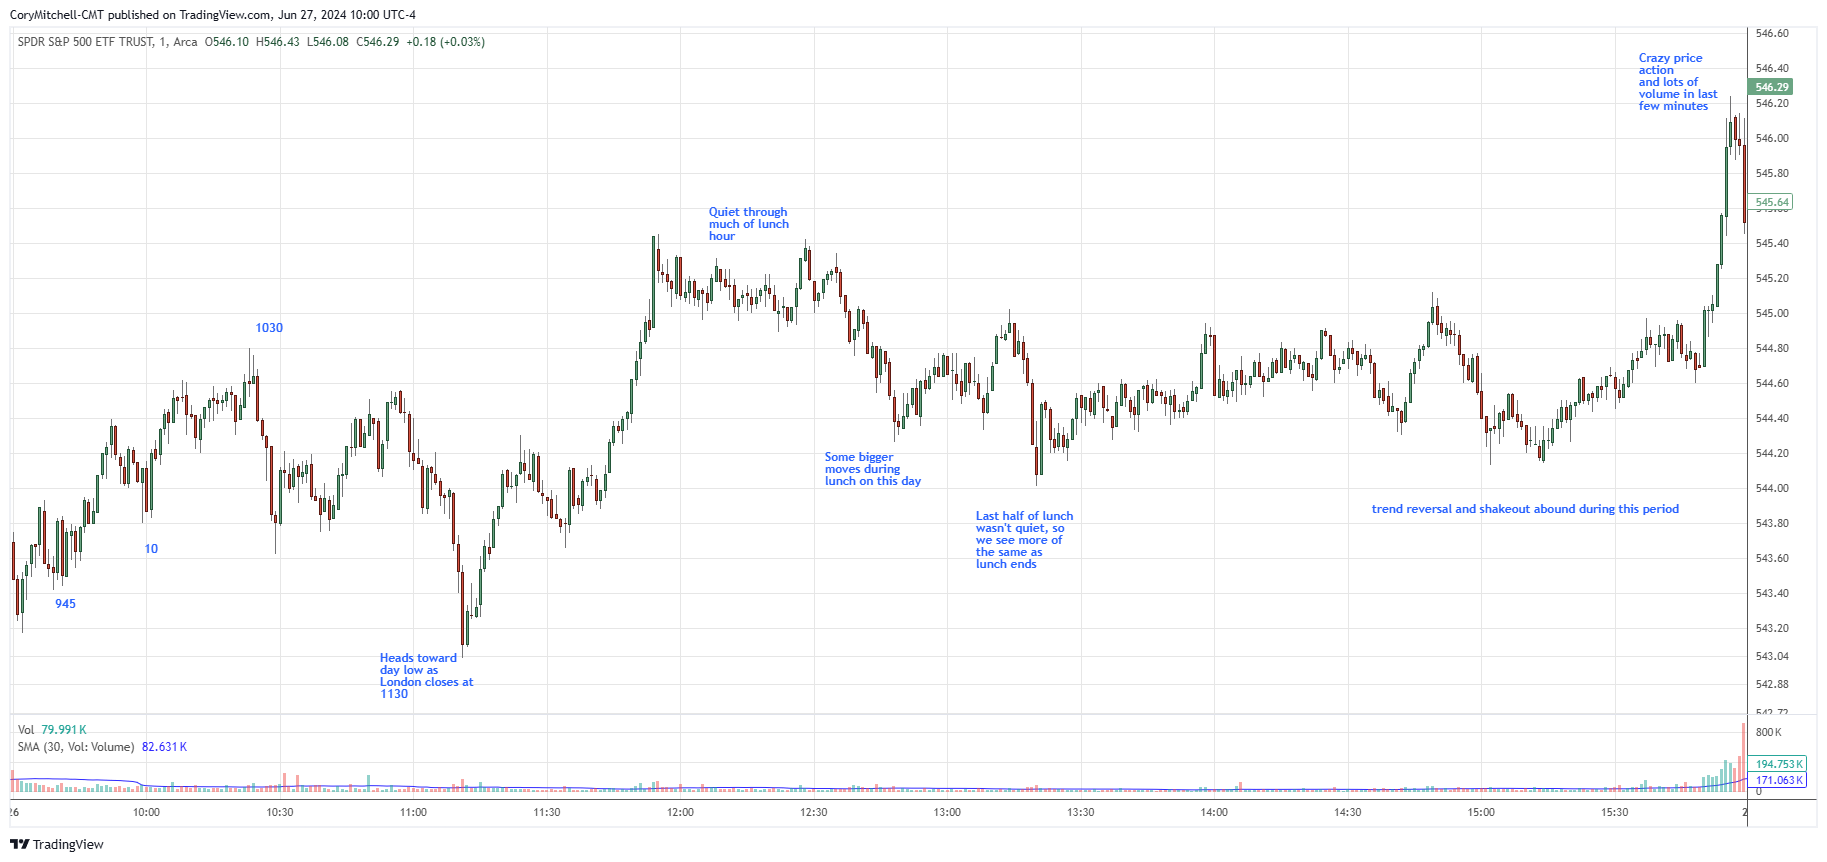
Below is a chart of SPY from July 26, 2024.
Individual Stocks Versus Stock Index Intraday Patterns
These tendencies apply to individual stocks and indices, as indices are simply the average movement of a bunch of stocks.
That said, when trading individual stocks, or even a specific index, make notes about how it moves.
There have been several times I’ve been trading a stock for a few weeks in a row and I notice that it has a very strong tendency to reverse around a certain time of day. I will wait till the price starts reversing and pounce on it when it produces my trade trigger. I will keep doing it day after day until the dynamic changes. Maybe the reversal signal no longer comes at the expected time. Stop trading it and look for other ways to capitalize on the movements.
Factors to Consider for Time of Day Stock Patterns
A major news event will disrupt these patterns, and so will persistent news or overall sentiment that’s causing increased or decreased volatility.
As discussed, these tendencies are typical, and tend to materialize under typical conditions.
If overall volatility is high, then intraday movement will be heightened with trends and reversals accentuated.
In quiet times, maybe only the first hour or two of the day will have action, and maybe the last hour, as stocks are more likely to drift with no catalysts or investor interest to move them significantly.
Holidays can also affect these patterns. For example, around Christmas and New Year the stock market is open but there’s often much less volume than usual. That can translate to quiet days with little movement. There are exceptions, but if trading patterns, it’s important to understand the context around them, and what may affect them.
If you find these types of patterns useful, then use them. If you don’t, then don’t worry about them. There are many ways to trade. This is just something to consider adding to your trading if it interests you.
The EURUSD Day Trading Course teaches you how to day trade the EURUSD in 2 hours or less a day. This course is specifically designed to give you all the tools and strategies you need to day trade the EURUSD. No BS, just solid methods, strategies, and information
By Cory Mitchell, CMT
Disclaimer: Nothing in this article is personal investment advice, or advice to buy or sell anything. Trading is risky and can result in substantial losses, even more than deposited if using leverage.

15 Comments
Leave your reply.