

False breakouts frustrate many new traders. Pros know they are a part of trading and a huge opportunity. Here’s how to use them to your advantage.
You come up with a trade idea based on an important technical level. It might sound something like this: “If the CAD/JPY can break above the daily chart resistance level of this big triangle pattern, it will likely advance 300 pips or more over the next one to three months.”
The timeframe or size of the pattern doesn’t really matter, and neither does the asset being traded. The concept works the same on all timeframes and in all assets.
It’s a visible pattern, so lots of people are watching it. The price breaks above the pattern and starts to fly higher. It moves above the pattern…for a time…and then starts to tank. Profits evaporate and they are now in a losing position.
New traders are frustrated by this, blaming manipulation, algorithms, or stop loss hunters. They are angry or sad they lost (or didn’t make a big profit like they expected), and don’t realize a real opportunity to potentially make their money back is staring them right in the face.
False Breakouts are Often Tradable
False breakouts are a gift! Yes, there’s often a losing trade associated with a false breakout, but it’s not just you. Lots of people are losing on that false breakout! That’s the false breakout’s power. When a false breakout occurs, some traders are trapped in losing positions. They need to exit, helping to fuel the price move in the opposite direction. Those without positions (or positions opposite to the breakout) just saw the price try to move one direction and fail. Their conviction and position size is likely to increase in the failed breakout direction. So a failed rally results in hard selling, for example, after the price tries and fails to break higher.
Many traders are so focused on one trade, and trying to make money on that one idea, that they miss the power of getting into a trade in the opposite direction when an idea doesn’t work out.
I don’t reverse my position every time there is a false breakout, but when conditions are right it can work out well.
Below are some examples.
CAD/JPY had a beautiful and profitable false breakout to the upside. The pair was moving above a key level. The price ended up consolidating around that key level for some time (red box on the chart below). The price then broke to the upside. This made everything look really good for a further upside move. On a good breakout, the price should have run aggressively higher, and any pullback should have stalled near 83.70 or above.
Charts from TradingView.
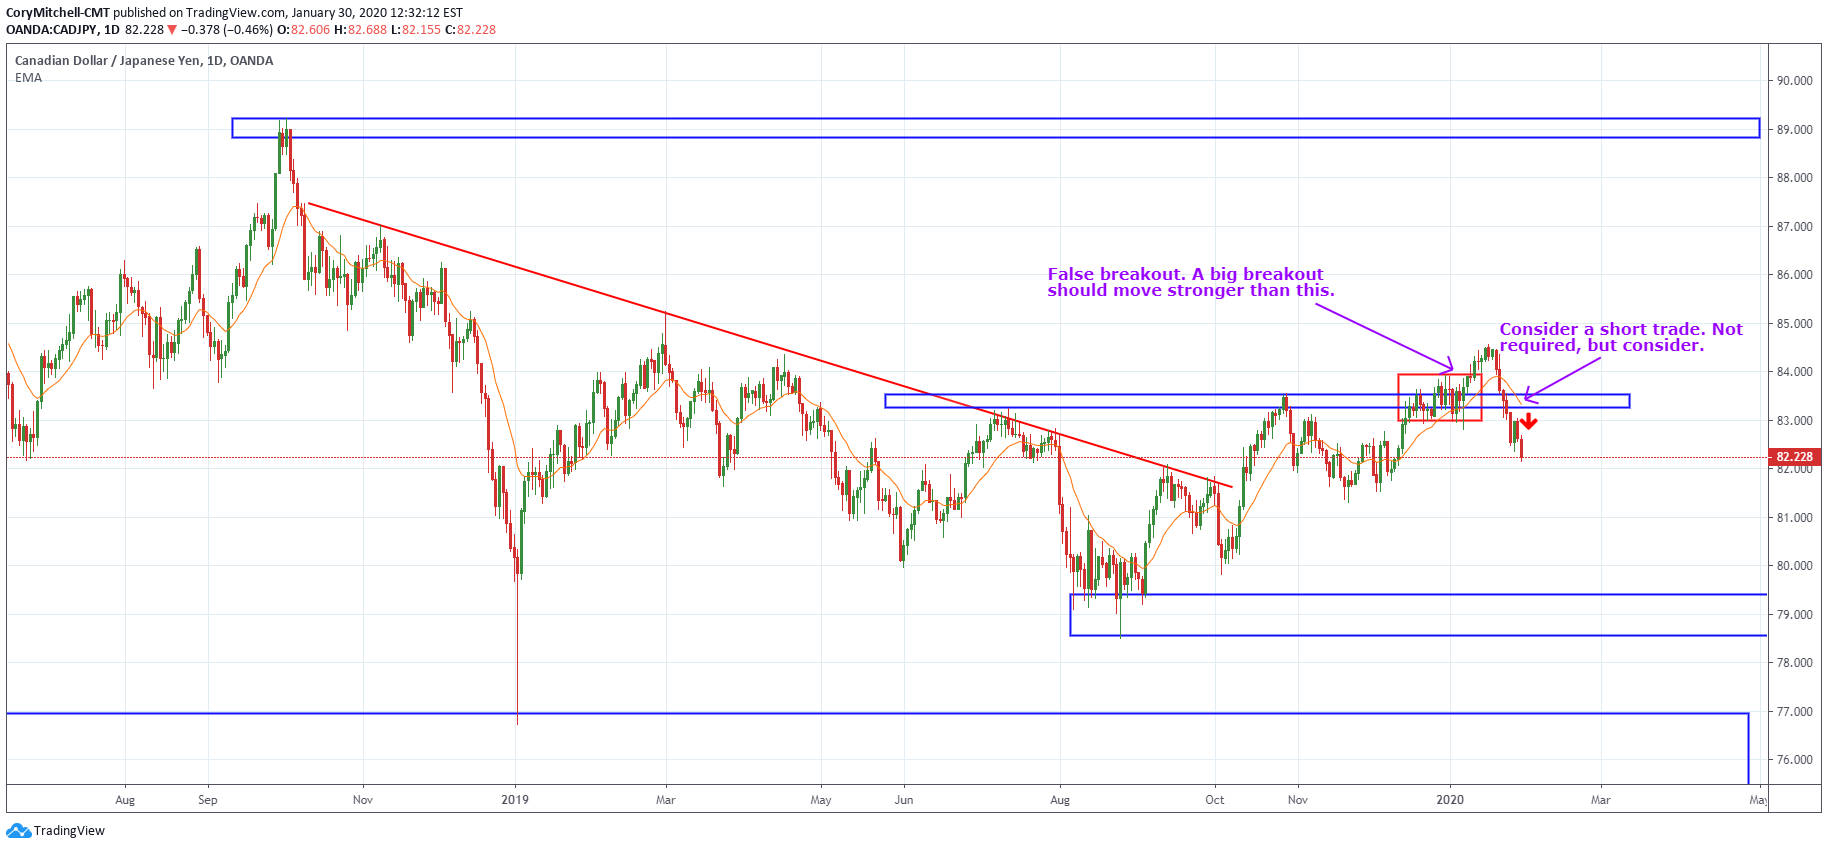
Instead of making a strong advance, the price stalled quite quickly and reversed lower. It dropped back below the prior consolidation (red box) without slowing down. With stop losses placed in this location (below the red box), most who went long would have already gotten out with a small profit or loss, or would see their stop loss triggered below the consolidation. The price then continued to decline.
By the time the price reached 83, or even 83.60, a trader could be thinking “The upside breakout failed. Is there potential for the price to continue lower? Is there a valid trade to the downside?”
The trader would then assess their outlook, consider the reward:risk of the trade, and determine if switching to a short position makes sense. It may, or it may not.
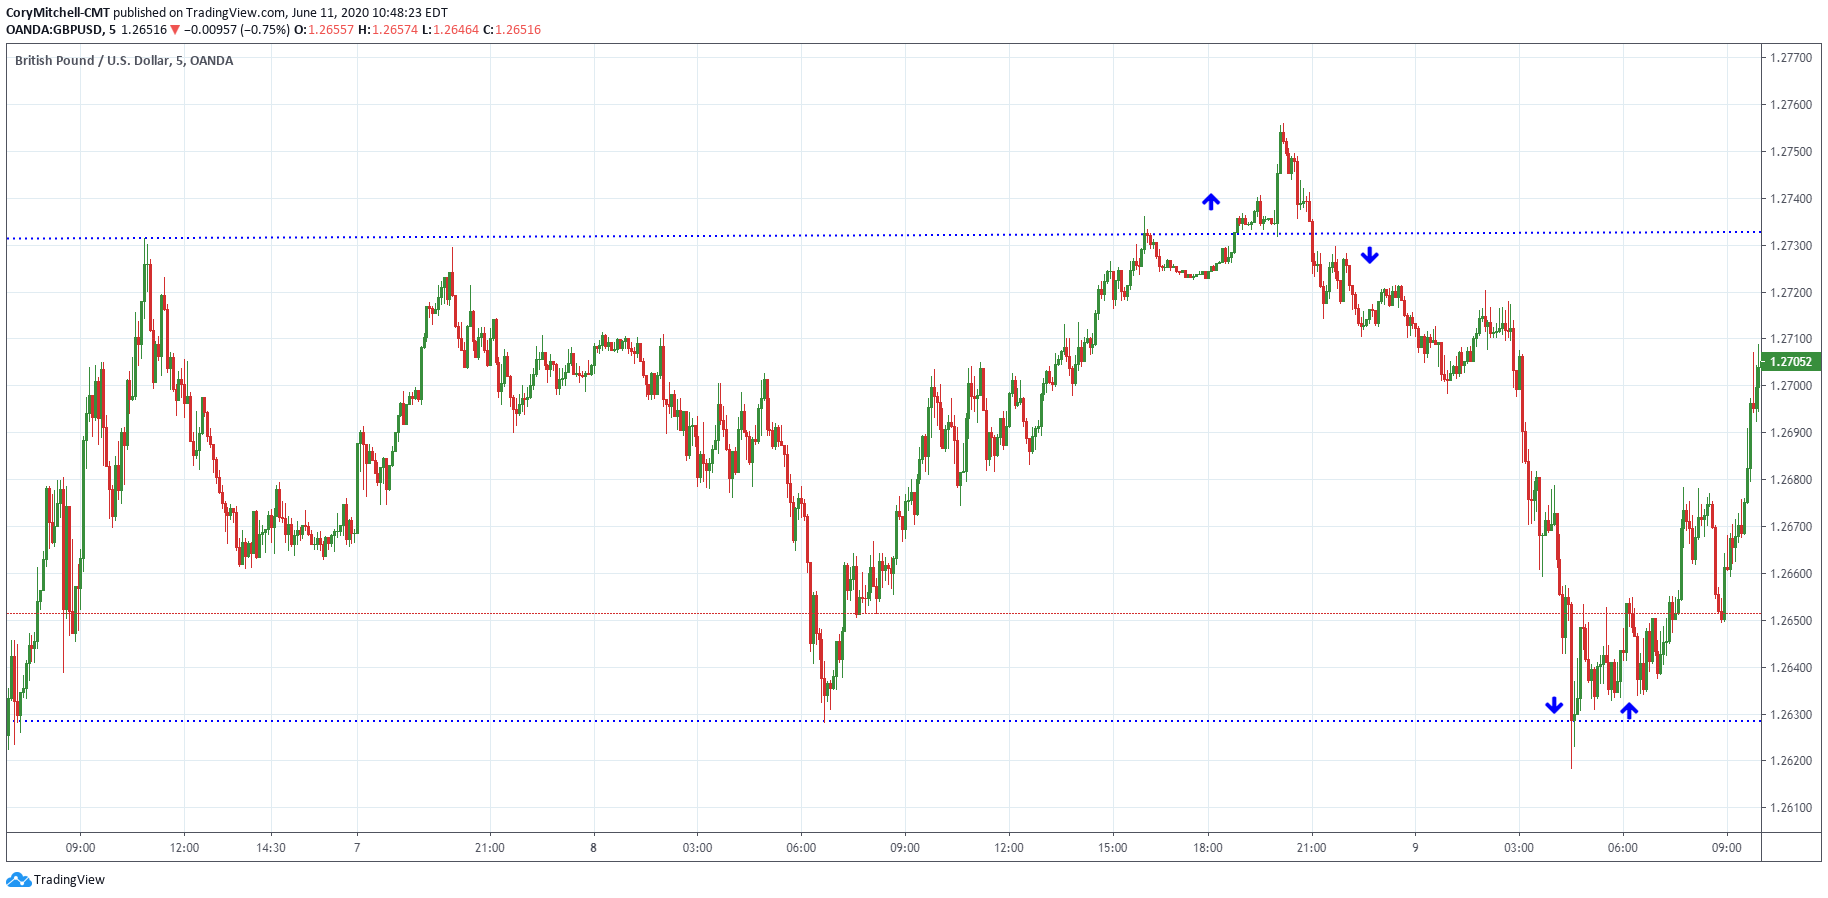
Below is another example. The GBPUSD had been chopping around in a range. It moves above the prior swing highs (dotted horizontal line) then collapses. Another false breakout occurs at the bottom of the range. The price drops below the prior low (dotted horizontal line), but then quickly rallies back to the upside. Such moves can create huge profit opportunities.
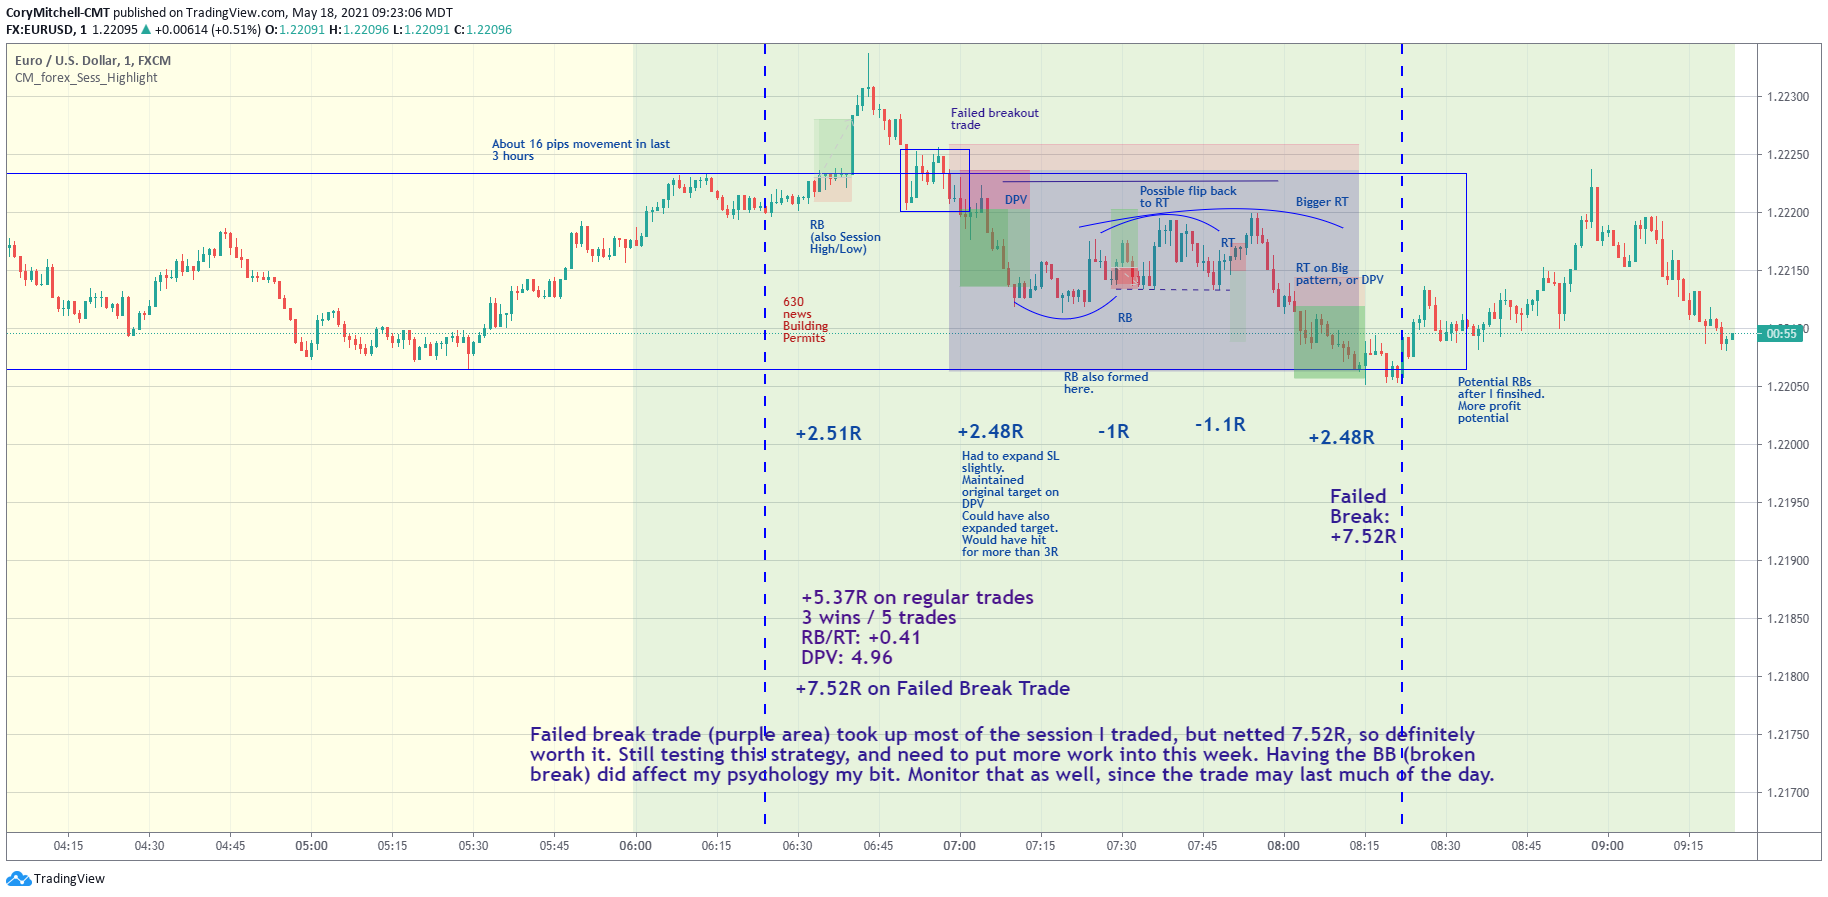
When EURUSD day trading, especially on sideways days, the price will tend to break out above the highs of the day or below the lows, but if that breakout fails, it will run toward the other side of the range. This is similar to the GBPUSD chart above, but on a smaller time frame.
On the EURUSD 1-minute chart, note the big purple box. This marks a potential short trade when the price broke above the high of an intra-day range but then quickly failed and started moving back down. I placed a target at the other side of the range for a big reward:risk trade (profit was the large purple box, while risk was the small pink box above it).
Below is another example. Look at the last trade. The price has been chopping around inside that rectangle I drew, and then it pops out the bottom. It’s a false breakout as the price pops right back into the old range and the pullback of that rally even stays inside the old range (see: Master Price Action Trading). When the price starts moving up again, hop on it. The price is likely heading back toward the top of the range because it already tried to go lower and couldn’t.
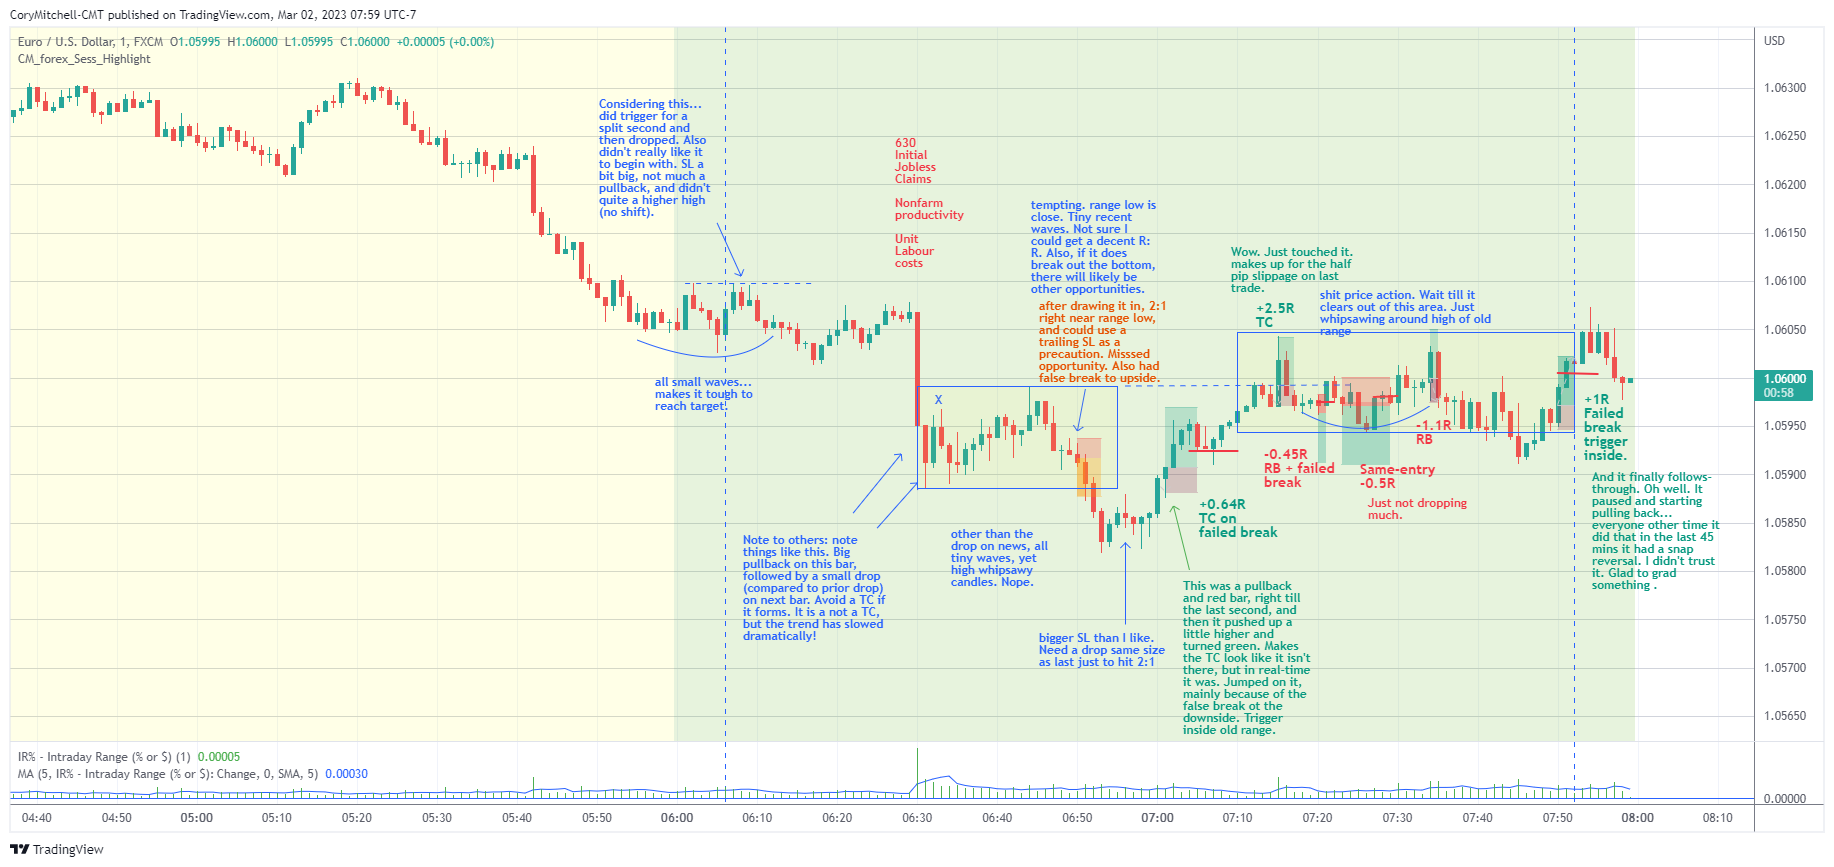
You’ll also notice that as the price started to chop around, and not trend, I took some losing trades. That is going to happen. Just like sometimes you will lose on trading a breakout when it turns out to be false. Just keep analyzing the price action. The opportunity to make money is often just around the corner (but don’t force it…let the trades come to you).
For more day trading strategies and ways to capitalize on common intra-day patterns, check out the EURUSD Day Trading Course.
Using False Breakouts to Confirm Trade Ideas
My favorite trades are when there is a really small false breakout in the opposite direction I want to go. For example, I want to go long, usually during a broader uptrend, on a consolidation breakout to the upside. The price drops below the consolidation (I’m not in the trade yet because I’m waiting to go long on a breakout to the upside) and then rallies above the top of the consolidation. I enter when the price moves above the consolidation. These trades have a slightly better chance of working out because the price already tried to go lower and couldn’t. I have more conviction that the price will rise as expected (relative to if there was no false downside breakout). This is especially powerful during a trend.

False breakouts aren’t always at major levels. As discussed above, a false breakout can occur on a consolidation. It can also occur near a recent swing high or low during a trend.
Let’s say you’re interested in getting long a stock. The price has been rising, then it declines into a pullback. It bounces a bit and then the next decline just barely drops below the prior swing low before bouncing again. Since the price was barely able to push to new lows, that tells you the sellers may be losing momentum. You don’t need to buy right away, but it is a piece of evidence to start watching for a long entry. See How to Spot Trends And Reversals Using Price Action for more on this topic.
Check out the following chart. The stock was forming a half cup and handle pattern. As the handle formed, we can see selling momentum falter when the price barely dropped below the prior swing low and then quickly bounces. The price then consolidates again, breaks lower, but then quickly snaps higher again. These two false breakouts to the downside helped confirm the long trade the overall pattern was signaling.
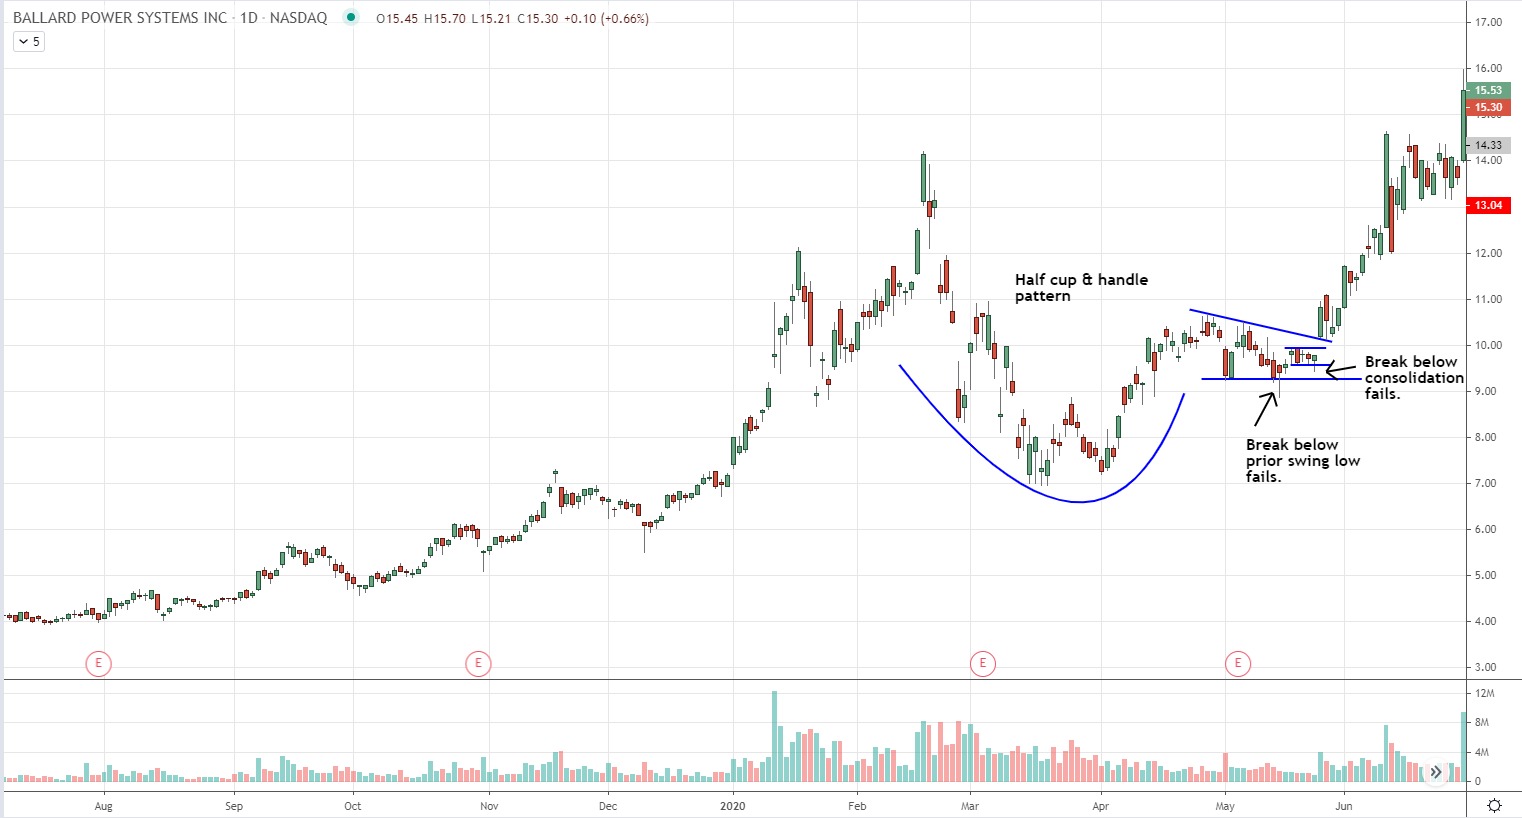
To learn how to trade half-cup patterns, and other explosive stock patterns like this, in the Complete Method Stock Swing Trading Course.
False Breakouts Around Events or Economic Situations
False breakouts can also be used around news or economic situations. If you have a bias toward a specific event triggering the price to move in a certain direction, you could wait for the price to make the opposite “fake out” move, and then when it moves the direction you expect, pounce. This approach has the added benefit of potentially keeping you out of a trade if your bias is wrong. If you think a news event should move the price up, you will be waiting for a false breakout down and then a rally up before getting in. If the price just keeps dropping, you saved yourself from buying into a losing/dropping trade.
During a BoE Rate decision I concluded that if the Bank of England held interest rates steady, the EURGBP would likely decline. I also know that most traders are not aggressively taking positions in the hour or two leading up to an interest rate announcement. It is often pretty quiet before major news announcements.
So it seemed odd when the price of the EURGBP broke above a 2-day swing high on a sharp rally, well before the major news announcement, only to halt and then drop back below the high. That was a shorting opportunity for a day trader, especially considering that the BoE announcement was still a few hours away.
If you were looking for an opportunity to get short, the false breakout to the upside was an ideal time to do it.

The false breakout higher resulted in a hard selloff back into the middle of range, providing a favorable reward:risk trading opportunity. While the price continued to sell off following the announcement, holding through a major news announcement is a gamble, so the short was exited prior to the announcement.
Should You Always Wait For or Use False Breakouts?
As discussed above, sometimes a false breakout can provide us with more conviction for a trade. Or it may present a new opportunity.
Since false breakouts seem to be helpful, you may think “Why don’t I always wait for false breakouts before taking a trade!?”
You very well could! But there is a trade-off. You may miss out on strong moves that break out and just keep going (no false breakout in the opposite direction beforehand). And false breakouts don’t always work out either. We may get a false breakout, and then the price keeps moving in the original breakout direction: the false breakout is false.
Ultimately, the choice is up to you. I don’t always wait for false breakouts, but if the direction is unclear, or I need more evidence to signal a trading opportunity, a false breakout may provide me with that. So I use them sometimes, but don’t require a false breakout before every trade I take. When a stock or forex pair is moving very strongly, it typically just runs and won’t have a false breakout beforehand.
Working False Breakouts Into Your Trading Plan
Every trade taken should be a part of your trading plan. This article is meant to simply spark the idea that false breakouts can be tradable and helpful.
The next step is to consider when you will trade false breakouts, or use them to your advantage, and under what conditions? Where will you enter, take profit, and place stop losses? Once you establish these things, include them in your trading plan so you can start practicing these trades—potentially in a demo account or with a tiny position size until your strategy is profitable.
Typically, the more convinced I am a trade will work out—because everything looks so good—those are often the trades that have the biggest false breakouts and moves in the opposite direction (IF a false breakout occurs). If you are convinced a trade looks awesome, probably lots of other people are thinking the same thing. IF it doesn’t work out, lots of people will be trapped which means a hard move the other way.
In trading, if the stars align but the price doesn’t do what you expect it to, get out (or go the other direction)! This isn’t a rule, but a pretty good guideline.
For more ways to capitalize on price moves, check out my stock trading and forex courses. Everything you need to start building your edge in the markets.
By Cory Mitchell, CMT.
Disclaimer: Nothing in this article is personal investment advice, or advice to buy or sell anything. Trading is risky and can result in substantial losses, even more than deposited if using leverage.

2 Comments
Leave your reply.